
Before you start
- You need Enquiry Management and View on Enquiries.
Steps
-
In the sidebar, select CRM › Reports & Analytics. "CRM Reports & Analytics" opens: "Track pipeline, conversion, and demand patterns for your enquiries". It starts with the last 90 days, ending on your company's today.
-
To change the range, select 7 days, 30 days, 90 days or 1 year, or pick the From and To dates. To cannot be later than today.
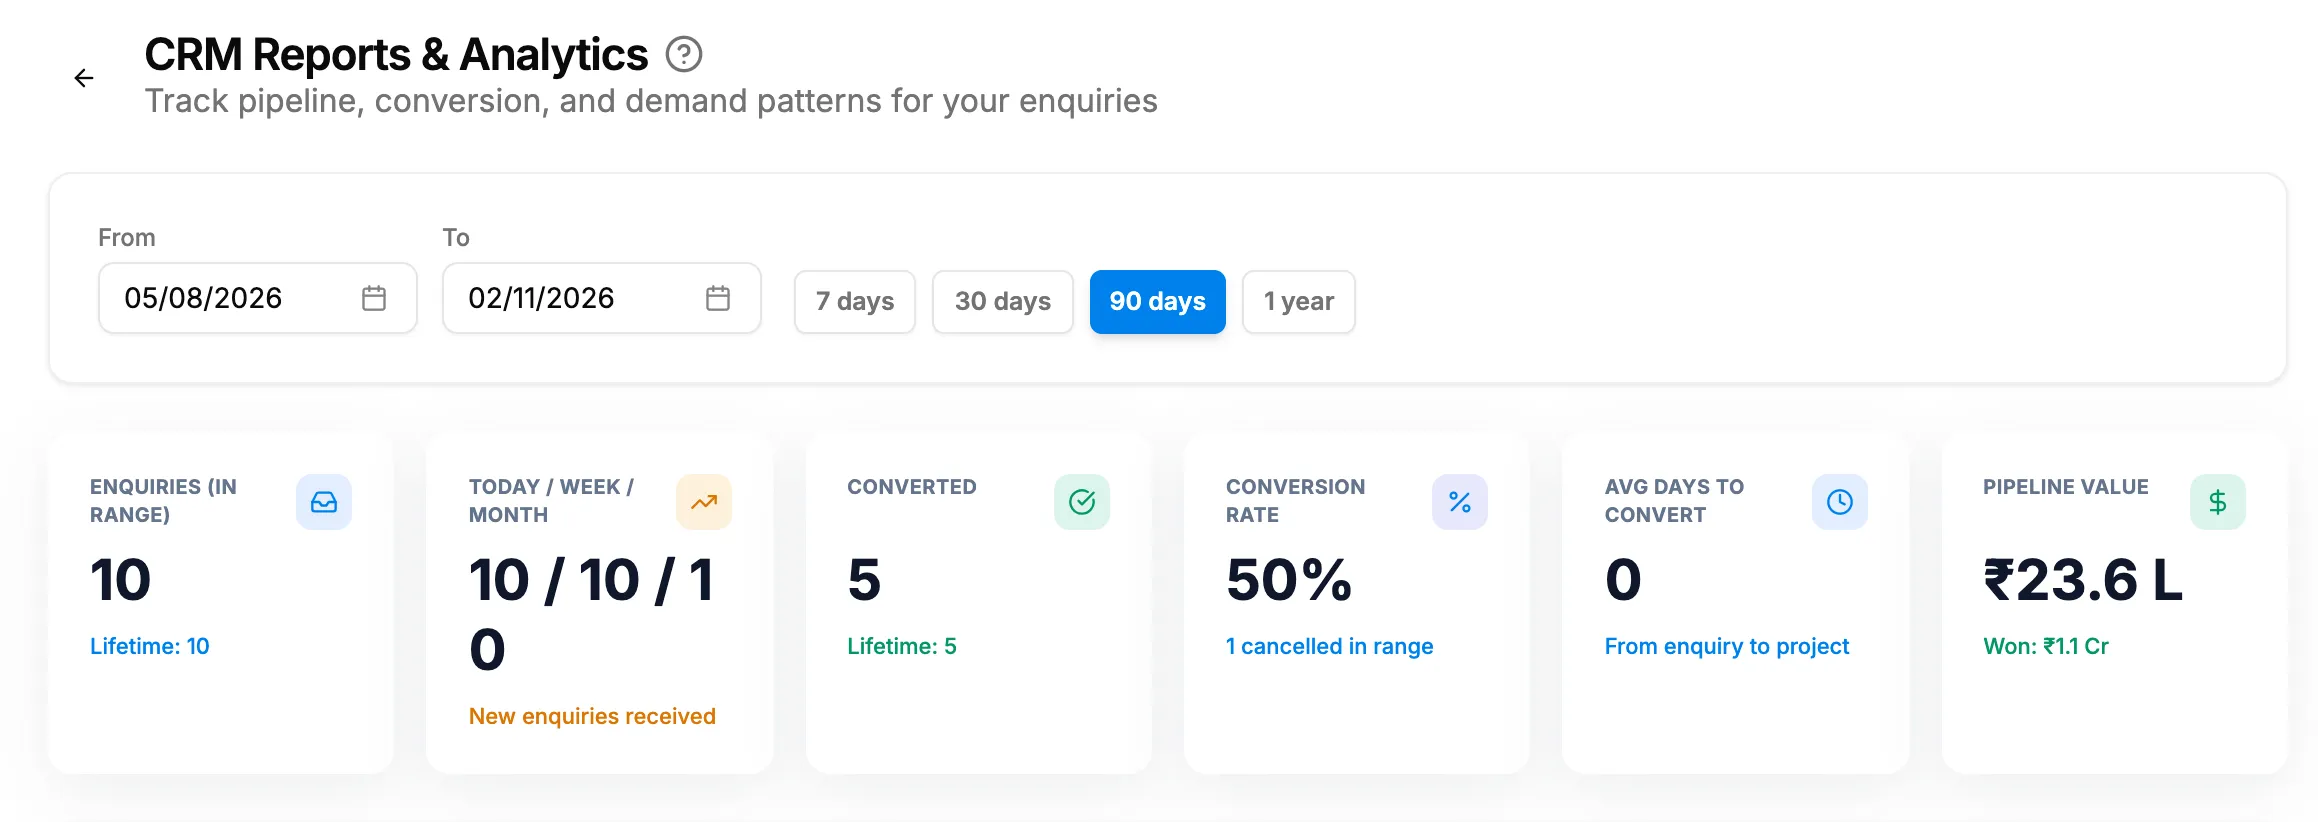
Step 2. The date range with the presets and the stat cards. -
Read the cards:
- Enquiries (in range), with the lifetime count.
- Today / Week / Month: new enquiries received.
- Converted, with the lifetime count.
- Conversion Rate, with how many were cancelled in the range.
- Avg Days to Convert: from enquiry to project.
- Pipeline Value, with the value won.
-
Read the charts: Enquiries Trend (daily new enquiries), By Status, By Priority, By Source and By Project Type.
-
Read the tables: Team Performance ranks the assignees by enquiries handled in the range, with Total, Converted and Conversion Rate. Recent Conversions lists the last 5 enquiries that became projects.
Result
The page shows the figures for the range you chose. The page has no export.
If something is different
- "No analytics data available.": there is no enquiry data to show. Check that enquiries exist. See Add an enquiry.
- A chart says "No data", "No enquiries in this date range", "No assignment data" or "No conversions yet": nothing matches the range. Choose a longer one.
- Avg Days to Convert shows a dash: there are no conversions to measure.
- An Unassigned row in Team Performance: enquiries with nobody in Assigned To.
- "Failed to load analytics": reload the page.
- Deleted enquiries are not counted.